Digital Media, New Tools and Technology - Week 2
In week 2 of the Instructional Design: Digital Media, New Tools and Technology course, we studied what visual design consists of. There was a focus on the simplicity of design, and being able to critically look at the elements of design. Part of the task is to look and determine if the design adds value or serves a purpose.
We were then introduced to several online resources or tools for creating visual design elements. Several of those listed I have used previously, and they are extremely useful to create a quick graphic or visual element. My favorite go to places include Canva, Venngage and Piktochart.
Finally, we were given two tasks:
1. Update the Digital Checklist from Week 1
2. Create a digital document that could be used in an educational course.
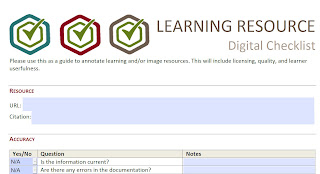
I only had one change to my digital checklist. I added a checklist item to evaluate if a graphic portrays diversity and inclusion. In my current position we are continually evaluated on this aspect of all the deliverable's we create - and I realized this would be important to evaluate as the digital resource is sourced.
Here is my updated Digital Checklist.


We were then introduced to several online resources or tools for creating visual design elements. Several of those listed I have used previously, and they are extremely useful to create a quick graphic or visual element. My favorite go to places include Canva, Venngage and Piktochart.
Finally, we were given two tasks:
1. Update the Digital Checklist from Week 1
2. Create a digital document that could be used in an educational course.
I only had one change to my digital checklist. I added a checklist item to evaluate if a graphic portrays diversity and inclusion. In my current position we are continually evaluated on this aspect of all the deliverable's we create - and I realized this would be important to evaluate as the digital resource is sourced.
Here is my updated Digital Checklist.
For part 2 - I created a resource which I would use as part of my visuals on my course "Managing your Digital Footprint."
This would be an element of the course, where we would discuss the benefit of Word of Mouth.
I created the infographic in Adobe Illustrator. Some of the design elements I created, and others I procured from the internet, sourcing for the images are at the bottom of the graphic. I also used images from Vyond.com. I have a license to use the images in video and other digital formats. The data used came from a report from Convince & Convert, LLC entitled Why Chatter Matters.
Here is the link to my infographic - The Word of Mouth Evolution. Select the link to view the full graphic.
This work is licensed under a Creative Commons Attribution-NonCommercial-ShareAlike 4.0 International License.
Comments
Post a Comment